Bear Trap Crypto Trading Guide: What Is A Bear Trap And How To Spot It?

This blog post will cover:
- IntroductionPicture this. Bitcoin slices through a widely watched support, alarms go off, shorts pile in, and longs get stopped. Minutes or hours later, price rips back above the level and keeps running. That sharp reversal is a classic bear trap. In a crypto bear market, false breakdowns can be brutal because volatility, leverage, and thin liquidity magnify every mistake.
- What Is a Bear Trap?
- How Bear Traps Work
- How to Spot a Bear Trap
- How to Avoid a Bear Trap?
- Case Studies
- Round-Up
- FAQs
- Glossary
IntroductionPicture this. Bitcoin slices through a widely watched support, alarms go off, shorts pile in, and longs get stopped. Minutes or hours later, price rips back above the level and keeps running. That sharp reversal is a classic bear trap. In a crypto bear market, false breakdowns can be brutal because volatility, leverage, and thin liquidity magnify every mistake.
This guide lays out a clear framework to read those moves, spot traps with real confirmation, and build a repeatable trading strategy that focuses on context, evidence, and risk control. We provide bear trap stock example and otherwise, answer the question of “what is a bear trap in stocks” and more.
This content is educational only and does not constitute financial advice in any form.
What Is a Bear Trap?
Let’s set the foundation before we get tactical.
Definition and Meaning
So, what’s a bear trap? It is a false breakdown below support. Price dips under a key low, triggers stops and fresh shorts, then quickly reclaims the lost level and drives higher. The move often forms where liquidity clusters below swing lows, so that large orders can fill as retail traders exit in panic.
Bear trap market instances show up on any timeframe (from a one-minute chart to weekly) and the pattern is the same: a sweep of the low, a reclaim, and then expansion back into the prior range.
Bear Trap vs Bull Trap
Bear trap stock market occurrences fool traders into shorting a breakdown that fails. Bull traps do the opposite – a breakout above resistance that rolls over. The psychology flips, the liquidity location flips, and the invalidation flips. The goal here is to separate the two in a glance, then trade only when confirmation matches your plan.
Comparison Table
Feature | Bear market trap | Bull market trap |
False signal | Breakdown below support | Breakout above resistance |
Liquidity focus | Stops below prior lows | Stops above prior highs |
Typical wick | Long lower shadow then reclaim | Long upper shadow then failure |
Volume tell | Weak on break, stronger on reclaim | Weak on break, stronger on rejection |
Trader emotion | Fear and FOMO-shorting | Greed and FOMO-buying |
Invalidation | Clean close back below reclaimed level | Clean close back above failed breakout |
Bear Trap vs Real Breakdown
Not every break is a trap. Real breakdowns keep pushing lower with follow-through, rising or expanding volume, and structure that agrees across timeframes. Traps tend to snap back quickly, often within the same session, and they leave a clear wick through a prior low.
Watch for 2–3 cues:
1) momentum and volume failure on the break,
2) a decisive close back inside the range after the sweep
3) alignment with higher timeframe trend – real breakdowns usually travel in the direction of the dominant higher timeframe.
Bear trap meaning that trading improves when you demand those confirmations before acting.
How Bear Traps Work
Now that the label is clear, we can dig into mechanics and behavior that create the setup.
Market Mechanics and Liquidity
Markets move toward liquidity. Below range support and swing lows sit clusters of stop orders and pending limit buys. When price taps those pockets, you often see a quick liquidity sweep – a run below the low that triggers stops, fills larger buy orders, and then flips back up once the orders are absorbed.
This is why so many traps print as single or few-candle wicks (a bear trap finance chart sighting) that reclaim the level fast. Think of it as a stop hunt that clears the road for the next leg higher.
Trader Psychology
Fear, anchoring, herd behavior – traps feed on them. Traders chase the initial break because it feels obvious, or they place stops directly under the most obvious low with no secondary invalidation.
Meanwhile, patient participants fade extremes and wait for confirmation, letting the crowd do the heavy lifting. When shorts enter late and the chart flips, forced covering adds fuel to the rally out of the trap.
Conditions in Crypto Bear Markets
Crypto often runs on high leverage with thinner books than traditional markets. During downtrends or risk-off phases, that mix amplifies fakeouts. Volatility spikes, order-book depth can thin out at certain hours, and derivatives open interest swells, which turns small moves into squeezes.
Bear traps are especially common around higher timeframe levels and during news drops. Data providers have documented flat or fragile depth since major shocks, record or elevated open interest, and large liquidation clusters that fire in waves.
How to Spot a Bear Trap
Detection is a process, not a hunch. Let’s stitch context, clues, and execution into one plan to be able to spot bear trap crypto occurences.
Market Context and Structural Alignment
Start with the weekly and daily charts. Mark the key higher timeframe support and resistance, and take note of where recent weekly and daily closes sit. That gives you the bias. If the higher timeframe is sideways but holding a major floor, you already know to be cautious on breakdowns into that area.
Only after this step should you drop to intraday charts and map the local range, yesterday’s low, and any obvious swing points that price loves to sweep.
Once your levels are set, wait for the puzzle pieces to agree. A potential trap looks stronger when a lower timeframe sweep happens right at a higher timeframe level and then price quickly reclaims that level. If your daily bias is up or neutral and the lower timeframe shows a failed breakdown that closes back inside the range, you have alignment. If the signals disagree, skip it.
The goal is to trade harmony: higher timeframe bias, lower timeframe trigger, and a reason to believe liquidity has just been run. Discipline here removes a lot of the noise and keeps you out of marginal setups.
Technical and Sentiment-Based Clues
Blend volume, momentum, and derivatives metrics. First, watch volume behavior. Traps often break down on declining or average volume, then reclaim on expanding volume. The reclaim candle should be decisive, not a tiny doji.
Second, look for momentum divergences such as RSI or MACD showing higher lows while price pokes to a marginal lower low. That internal strength often precedes the flip.
Third, check derivatives data. Combinations like negative funding with rising open interest can signal crowded shorts. That backdrop often precedes squeezes if price snaps back above the level. Exchanges explain funding as periodic payments between longs and shorts to tether perp prices to spot, while open interest tracks outstanding contracts. Together they paint the crowding story.
No single metric is enough. You are stacking evidence. For instance, research notes have warned that rapidly rising open interest alongside negative funding can set up violent short squeezes. In past Bitcoin and Ether reversals, this pairing coincided with sharp reclaim moves after liquidity sweeps, flipping sentiment in hours. Treat this as context for the price action you see, not a green light on its own.
Price Action Triggers and Execution Signals
Here is the core trigger pattern: sweep → reclaim → expansion. Price wicks below a prior low, quickly reclaims the level, and prints a strong close back inside the range. Entries often improve when you wait for a candle close above the reclaimed line instead of jumping on the wick itself. That time-based confirmation filters a lot of fake flips.
Pair the trigger with your earlier context and derivatives read. When the sweep lines up with a higher timeframe level, volume expands on the reclaim, and sentiment shows crowded shorts, conviction increases.
Pre-mark the invalidation (typically a clean close back below the reclaimed level) so if the market fails you exit without debate. Patience matters here. Let the market confirm the idea instead of trying to predict it.
Quick Detection Checklist
Higher timeframe support nearby and marked
Clear liquidity sweep of a prior low with a long lower wick
Rapid reclaim and candle close back above the level
Expanding volume on the reclaim, weak volume on the break
Derivatives confluence – negative or falling funding with steady or rising open interest
Momentum divergence building into the low
Hard invalidation level and plan for position size in advance
A proper example of bear traps is some of the Bitcoin behavior over the last year. Namely, how it dropped to $82.000 in late March, only to reach $109.000 in June and break through ATH of $126.000 in October.
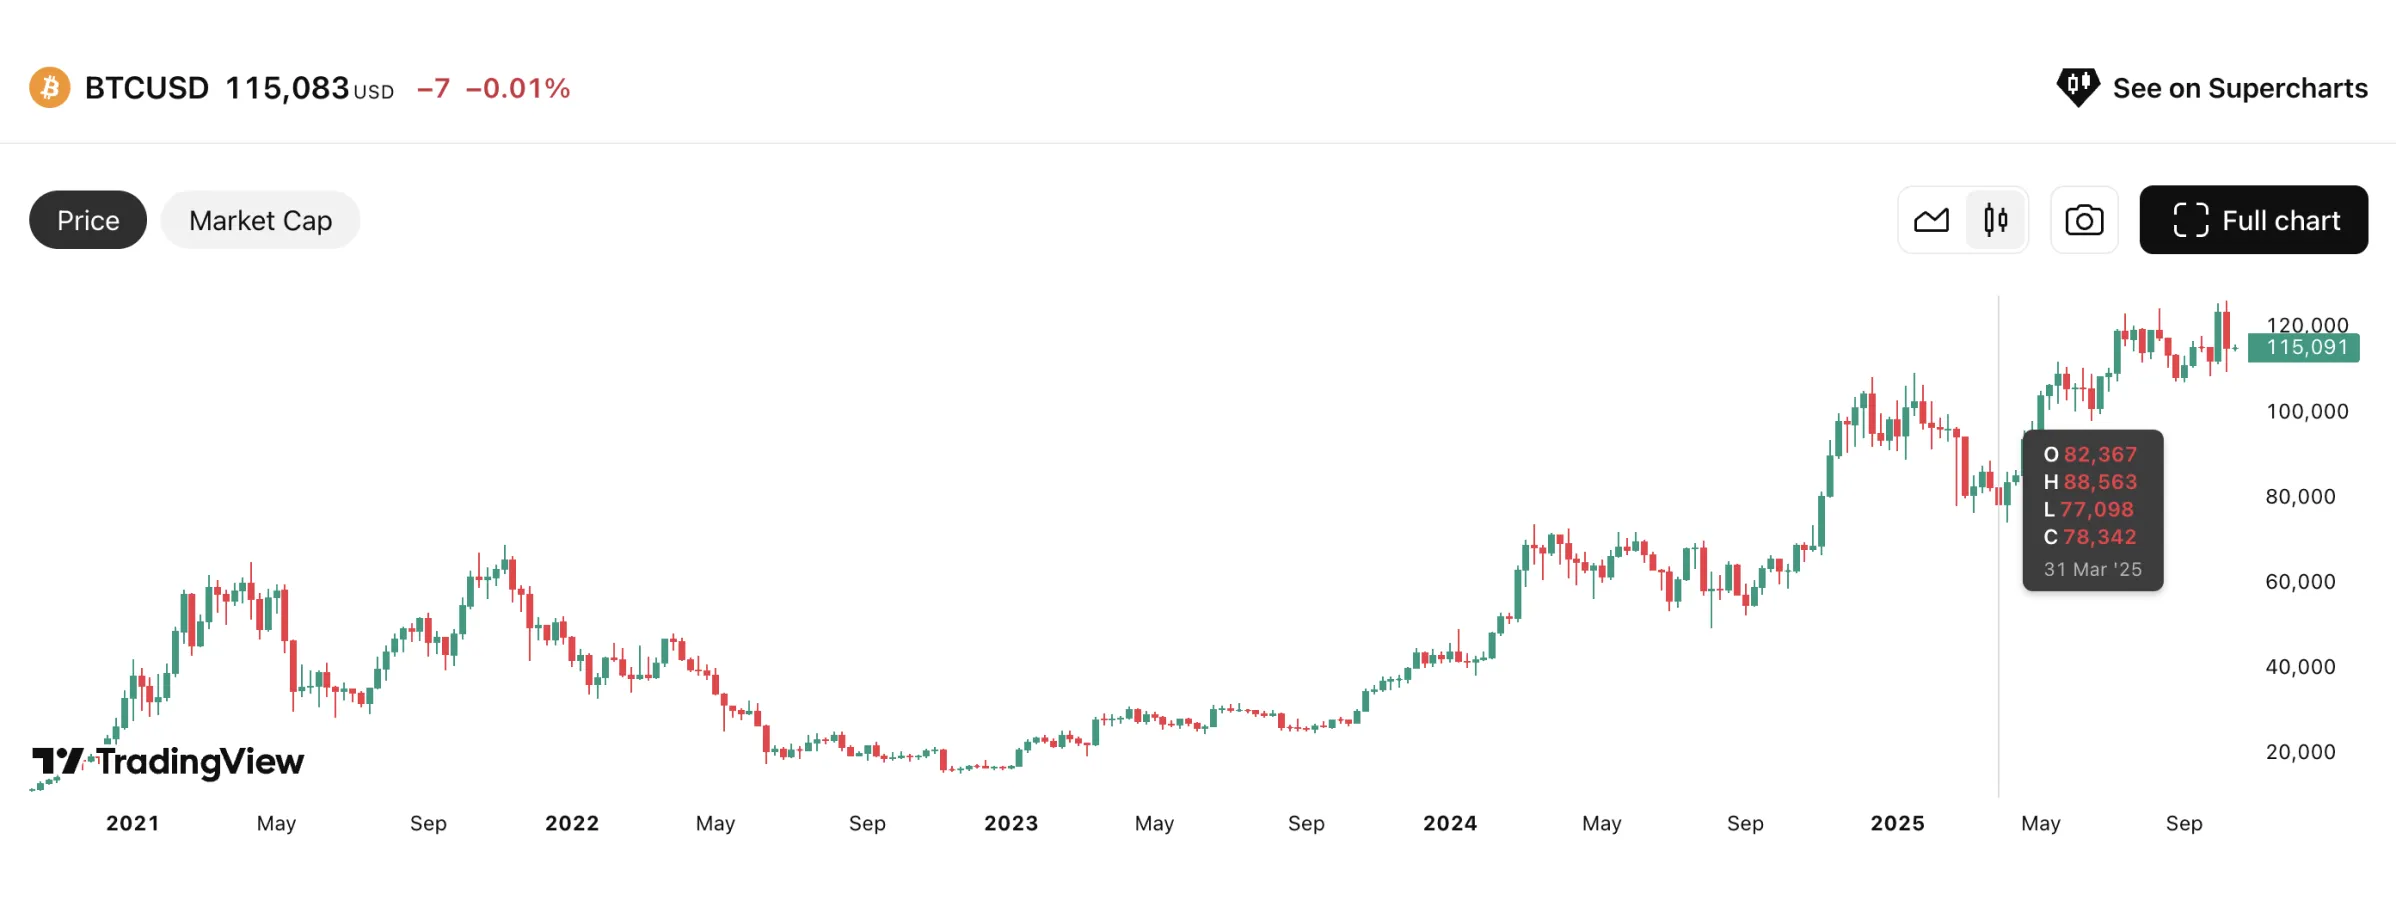
Source: TradingView
How to Avoid a Bear Trap?
Before we talk tactics, keep the theme simple – preparation first, confirmation second, risk always.
Effective Strategies to Avoid Bear Traps
Do your own research (DYOR) and plan ahead
Spend time each day and week marking the bigger levels, recent weekly and daily closes, and likely liquidity pools. Add a quick news scan so you know what calendar items or headlines could spark abrupt sweeps. Liquidity mapping turns chaos into a map.
Wait for trend confirmation
Let price reclaim the lost level and close back inside the range before re-entering. Look for volume to expand on the reclaim and for momentum to stop making lower lows. Fibonacci retracements, moving averages, and RSI can support the case when they stack up near the same zone, yet they should not be the decision by themselves.
Monitor market sentiment and indicators
Watch funding rates, open interest, and where liquidation clusters sit. If funding is deeply negative while open interest is firm, you may be near a spot where a reclaim can squeeze shorts. On-chain or exchange data can add helpful color, but your trigger still lives on the chart.
Keep tools as supporting signals
Fibonacci confluence, RSI divergence, and a rising short-term moving average after the reclaim can strengthen the read. They do not replace confirmation. They simply round out the story you are telling yourself about the setup.
Long-Term Investment Tactics to Bypass Bear Traps
Investors who do not want frequent trades can reduce exposure to traps through structure and behavior. Build a researched thesis for each asset, then dollar-cost average on a schedule rather than reacting to every breakdown. That reduces the urge to sell into false lows.
Use partial scaling rules. For instance, scale in modestly near higher timeframe supports and keep cash for deeper discounts. If price sweeps a major level and reclaims it with improving breadth or volume, you can add a slice while keeping room for volatility.
Avoid heavy leverage and stick to a diversified crypto portfolio that fits your risk tolerance. The macro view (liquidity cycles, regulation, and adoption) can matter more than any single wick.
Risk Management Techniques Against Bear Traps
Use stop-loss orders
Place stops just beyond your invalidation, not right under the most obvious low. If your thesis is the reclaim, a clean close back below that reclaimed level means the idea is wrong. The stop then caps the loss and frees mental capital.
Position sizing
Small, consistent sizing protects the account when a pattern fails. Many traders cap risk per trade in the 0.5–1% range. That way a string of losses during choppy periods does not become a large drawdown.
Hedging and discipline
During uncertain phases, parking part of capital in stablecoins or using small offsetting positions can smooth the ride. More important than the instrument is the behavior – follow your plan, avoid moving stops, reduce trade frequency when volatility spikes, and let A-setups come to you.
This disciplined approach reflects the spirit of education found across reputable platforms – risk control sits on the same shelf as entries.
Common Mistakes to Avoid
Chasing the first break under support, ignoring the weekly or daily structure, depending on a single indicator, and trading without a hard invalidation are the usual pitfalls.
For example, shorting a low-volume push under a range low, then refusing to exit when price closes back inside, can turn a small loss into a painful one.
Overtrading the chop around big news is another costly habit. One clear plan beats five conflicting signals.
Case Studies
Examples help cement the process. The aim is not to predict, but to recognize the pattern and act only when signals align.
Case Study 1: Bitcoin Support Breakdown That Reversed
In July 2021, Bitcoin slid under the widely watched 30K zone and then bounced back above it within a day. Coverage at the time highlighted the quick reclaim and improving intraday momentum. The move wiped stops under the prior lows, then recovered toward 32–34K as buyers stepped in.
This fits the sweep-and-reclaim blueprint, and it came as sentiment was washed out. Episodes like this often appear alongside stretches of negative funding or elevated open interest that later unwind in a squeeze, a pattern derivatives analysts have flagged in multiple cycles.
Case Study 2: Ethereum Market Fakeout Before Rally
ETH has printed several “dip then flip” moves. One recent example saw a sharp intraday breakdown followed by a strong rebound, with volume spiking during the recovery – a classic trap signature. During other periods, analysts pointed to negative funding on ETH perps and warned that crowded shorts can fuel a squeeze once price reclaims lost ground.
When the reclaim aligned with higher timeframe structure and sentiment shifted, rallies accelerated. The lesson stays the same: wait for the close back above the level and let funding and open interest provide context, not the trigger.
Case Study 3: Altcoin Trap Triggered by News Event
News shocks often create textbook liquidity sweeps. In September 2021, Solana suffered a high-profile outage. SOL sold off fast on the headline, then stabilized and bounced as the network came back and buyers absorbed supply.
The sequence resembled a bear trap on lower timeframes – headline-driven flush through obvious levels, a long wick, and a reclaim once liquidity was cleared. The example ties back to our psychology and mechanics sections – panic first, absorption next, then recovery if structure reasserts itself.
Round-Up
You now have a compact framework for bear trap crypto setups. Start with higher timeframe context, mark weekly and daily levels, and wait for the sweep-and-reclaim pattern with volume support.
Layer in confluence from momentum and derivatives (funding and open interest tell you how crowded a side might be) and define invalidation before you click. Keep size conservative, use the checklist, and let patience carry the day.
This guide is educational, not financial advice. A consistent process tends to beat raw prediction over time, especially in a market where traps and whipsaws are part of the game.
FAQs
What Is a Bear Trap?
A bear trap is a false breakdown below support that quickly reverses higher. It often happens where stops are clustered under prior lows, creating a fast wick and a reclaim back into the range. See the definition section above for the mechanics and typical signals.
Why Do Bear Traps Happen?
They form around liquidity. Stops and pending orders stack below obvious lows, so a push into that pocket triggers flows that big players can absorb. Human behavior adds fuel – fear and chasing breakdowns – which turns a small breach into a flush that then snaps back. Awareness of structure and where liquidity sits can reduce the sting.
What Is the Difference Between a Bear Trap and a Bull Trap?
Opposite false signals. A bear trap is a failed breakdown under support. A bull trap is an opposite happening above resistance. The psychology flips, and so does the location of stops. The table in this guide shows the key contrasts in one place.
How to Spot a Bear Trap?
Stack evidence. Look for a sweep of a prior low, a swift reclaim with a strong close back above the level, volume expanding on the reclaim, a hint of bullish divergence, and derivatives context like negative funding with steady or rising open interest. Check that the higher timeframe is not fighting you.
How to Avoid a Bear Trap?
Plan levels in advance, wait for confirmation, and keep risk tight. Trade only when higher timeframe context, and sentiment data line up, and always set invalidation. Position size conservatively so a missed read becomes a small loss, not a setback to your whole month.
Glossary
Liquidity sweep: A quick push into a liquidity pocket that triggers clustered orders, often printing a wick before reversing.
Reclaim: Price regains a lost level and closes back inside the prior range.
Open interest (OI): The number of outstanding futures or options contracts that remain open. Rising OI can mean positions are building.
Funding rate: Periodic payments between longs and shorts in perpetual futures that help keep perp prices near spot. Negative funding means shorts pay longs.
Divergence: A mismatch between price and an indicator like RSI or MACD, often hinting at fading momentum.
Invalidation: A price level or closing condition that proves a trade idea wrong and triggers an exit.
Range: A sideways area where price oscillates between support and resistance.
Follow-through: Evidence that a move is continuing, often shown by persistent candles in the same direction with supportive volume.